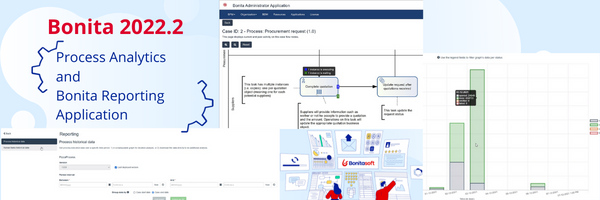
Improving your Business Process with Process Analytics and Bonita Reporting Application

Have you noticed that every time you execute a process you’re generating process execution data? The time at which it was started and ended, the accomplished activities, the involved resources, the data that was produced…all related to the execution of your process.
And have you ever wondered which steps of your process take a long time, or if there are any bottlenecks, or if there is a preferred time to start your process? Good news: by extracting and collecting your process execution data, you can analyze it and look for patterns on a dataset. This is called process mining.
Process Mining is a subfield of both data science and process management, used to analyze process execution data with the aim of improving it. “Improving” here means:
- detecting and predicting performance issues (e.g. delays, bottlenecks, high resource utilization);
- performing a root-cause analysis, and
- recommending corrective actions and process redesign.
Most process mining techniques use machine learning algorithms, in order to identify and give the hints to correct.
A complementary approach is augmented BPM. We can think about this as a continuous self-adaptive and self-improvement system, which identifies and corrects itself using AI technologies. Both approaches are trending topics and we’re so excited about them!
Where to start?
Data collection
Bonita 2022.2 Enterprise edition has integrated two important features:
- The ability to visualize process execution data on BPMN diagrams
- The ability to generate a report based on your processes
Integration of the bmpn-visualization library
We held a recent webinar called Dive Into Process Analytics, where we went through a deep dive to better understand how business processes are executed and how to optimize them. We introduced an independent project called Process Analytics, which is developing a set of open-source libraries and components to easily get a visual overview of business process data.
Now, we are happy to announce that we have integrated a brand-new feature, based on one of the libraries offered by this project, in the Bonita Enterprise Edition. In Bonita 2022.2, it is now possible to get the visual overview of your process data natively in the Bonita process and cases diagram visualization pages. Hooray!
Bonita Reporting Application
This application is capable of generating a complete report of the process execution data within the process and the timeframe of your choice. You will be able to:
- Retrieve data archived cases: period, state, execution time.
- Visualize a graph with average time spent on archived cases.
- Get information on flow nodes per case.
- Include sub processes data.
- Download the report as a zip or export it directly to another system (automatically or manually).
Also, it includes a specific section to focus on human tasks in cases for a specific process, version and period of time.
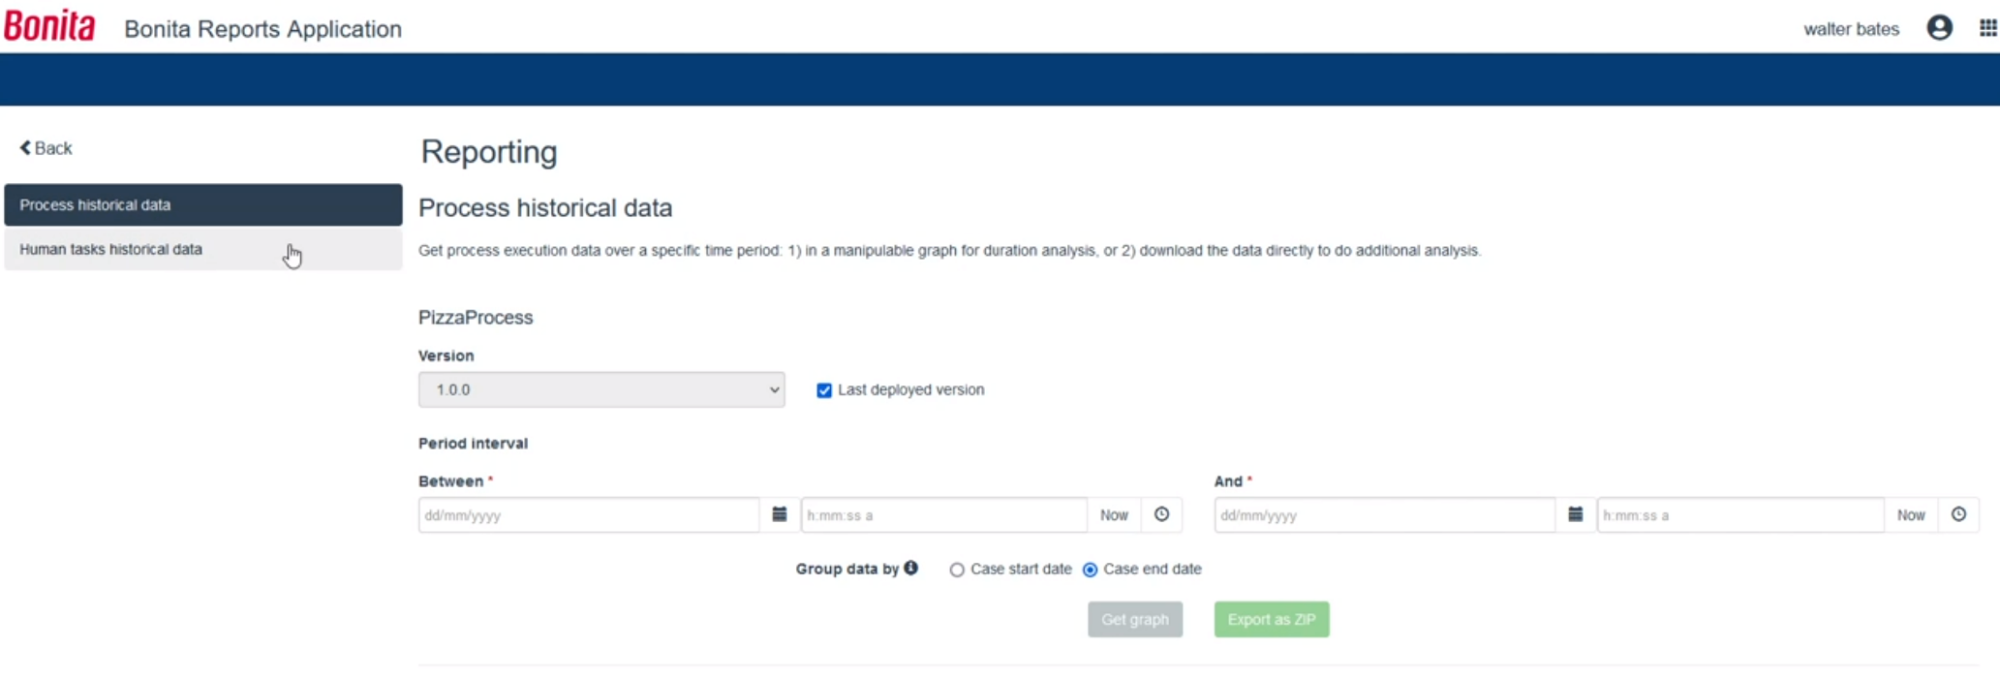
Bonita Reporting Application: Filter selection for historical data of a given process
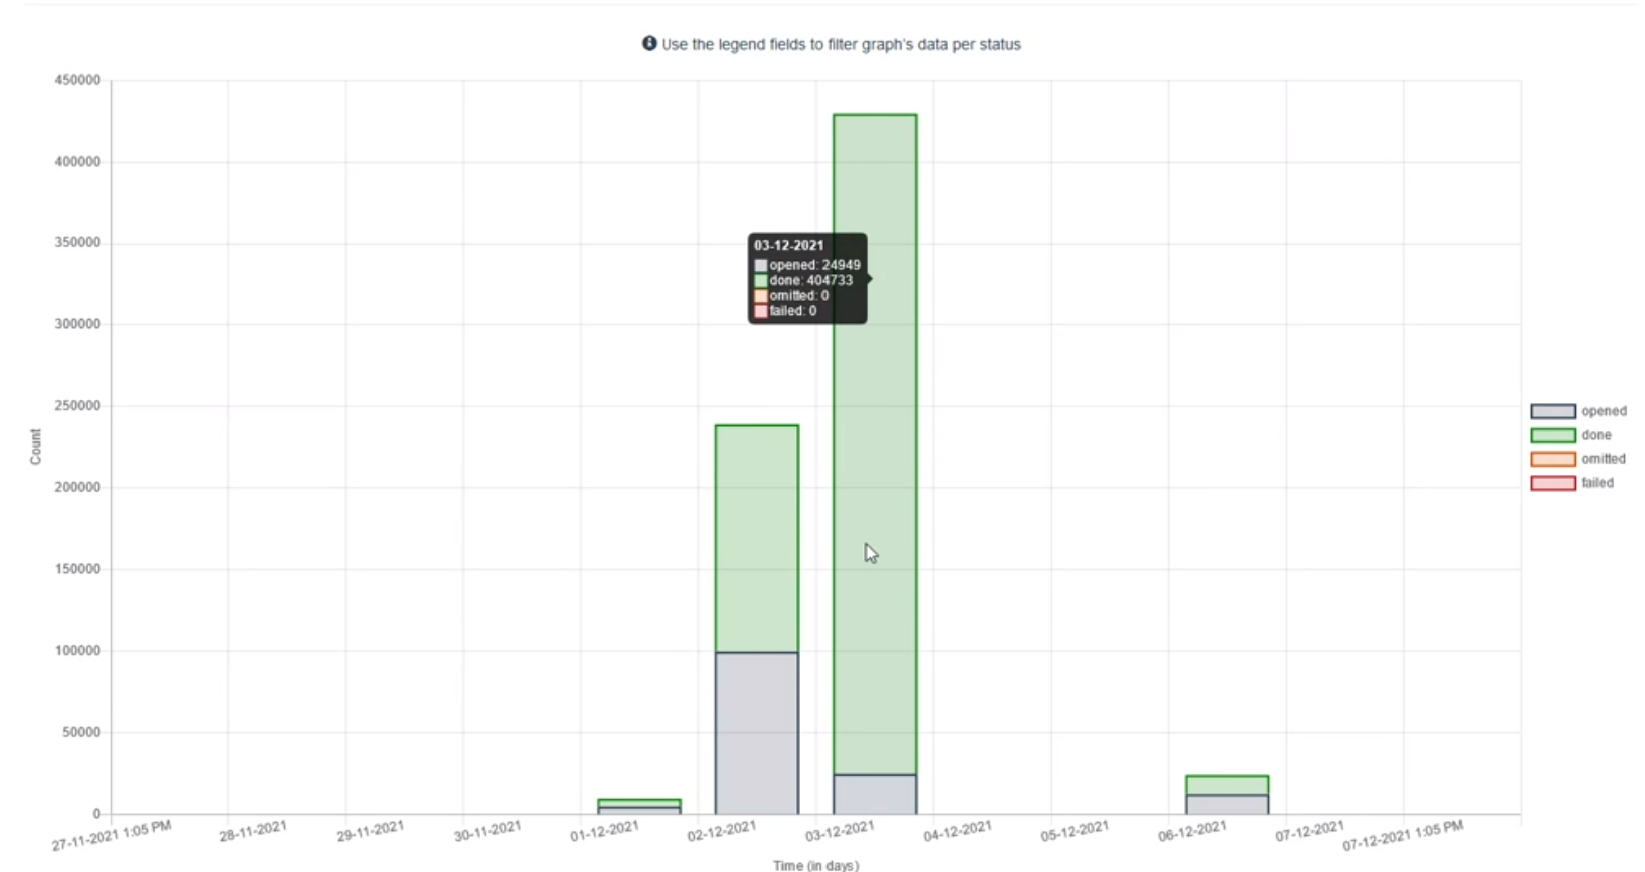
Bonita Reporting Application: Graph with average time spent on cases, separated by status.
Thanks to this data, you will be able to go further and improve your business processes.
Ready? Go!![]()
![]() If you’d like to know more about this topic, take a look at these articles:
If you’d like to know more about this topic, take a look at these articles: