Using process discovery on business process management (BPM) through BPMN - Chapter 2
In this series of articles started here, we are explaining our process for how to develop a way of visualizing the underlying process of an application in a BPMN (Business Process Modeling and Notation) format when only event logs are available. As noted earlier, the advantage of BPMN is that it is a widely used standard, and understandable by both analysts and technical teams.
Who?
This series of articles should be interesting to anyone who would like to ultimately be able to visualize their business processes when their applications are not based on BPMN processes (application administrators, for example).
In this article, we will explain the approach for this transformation, that is, the steps needed to extract the process semantic from the event logs using process mining tools.
Project overview
This project aims to automatically generate a BPMN file using only event log input. A BPMN file includes a process modeling method that visually shows the the organization of business activities.
It has 2 aspects: the semantics of the process, and a diagram that allows the visual arrangement of BPMN objects.
The advantage of this modeling is that is makes the process easily readable, and standardized in BPMN 2.0.
Generating a BPMN file from event logs
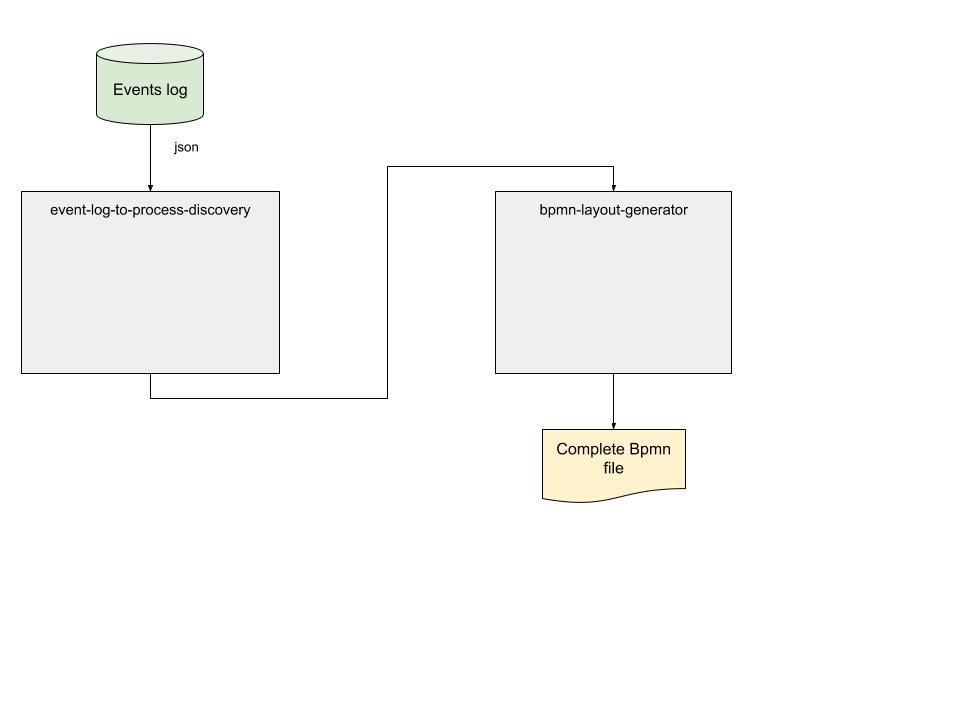
This project has 2 phases:
- create the semantic process from event logs (left side of the image)
- generate a diagram in a BPMN file (right side of the image)
Let's start describing Phase 1 in this article.
Phase 1: Semantic process generation
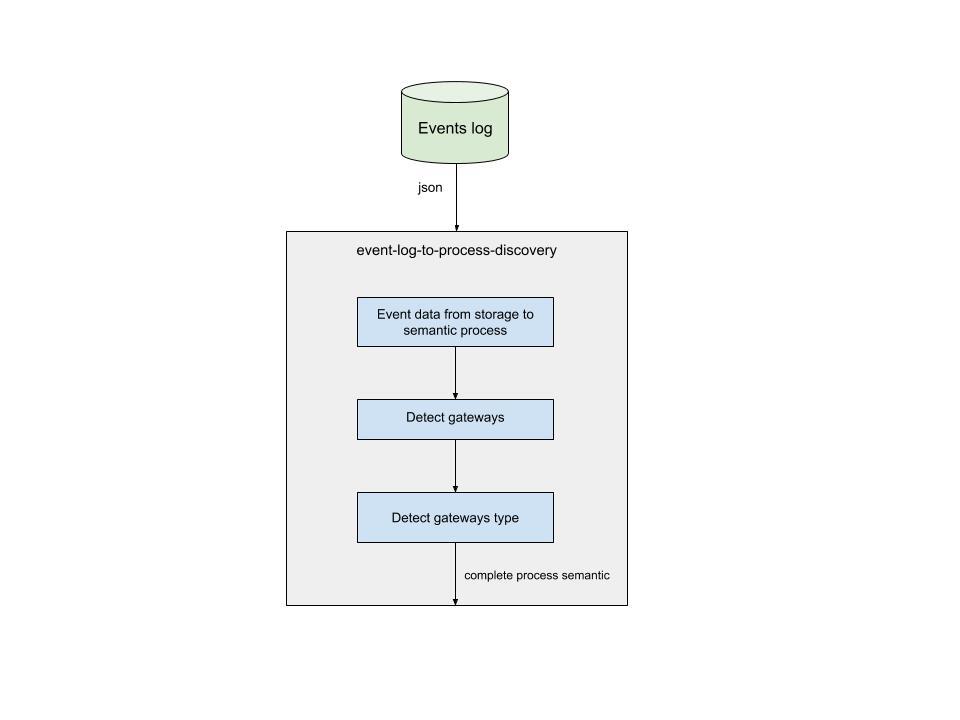
There are three steps to generate the semantic process:
- Extract event data from storage into a semantic process
- Detect gateways
- Detect gateway types
Semantic process generation
Step 1. Extract event data from storage into a semantic process: mine event logs
The event logs have the input data needed to create the BPMN file. They are made up of at least three types of data:
- case identity
- activity identifier
- timestamp
Example of a “patient” event log from R:
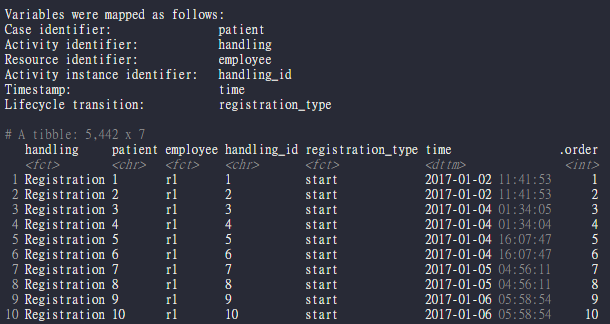
sample event log data
Process discovery mining tools use event logs to determine the semantics of the process in the form of data. Process discovery then uses the semantics of the process to draw the process visually.
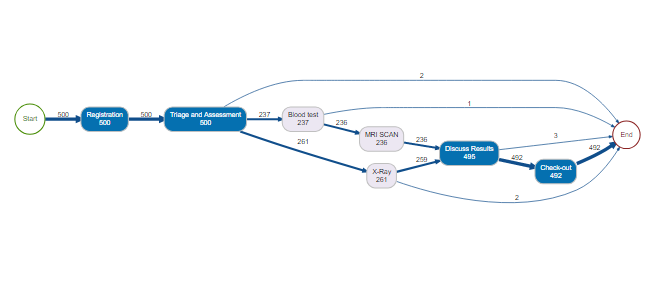
Process map visualization with bupaR
![[Process semantic extract from process mining tool]](/sites/community.bonitasoft.com/files/blog/olan/artificial_start.png)
Process semantic extract from process mining tool
This table contains the process semantics extracted from the process discovery, and will allow us to create the new BPMN objects needed to create gateways in the process diagram.
Step 2. Detect gateways
As we explained in the first article of this series, gateways improve the readability of the process.
If a task appears more than once in the "from" column, it means that it is linked to more than one other tasks. BPMN uses a gateway in this case, so a task will have a single output to the gateway and the gateway will then have multiple outputs representing the outgoing links to other tasks.
The same applies for the “to“ column: if a task appears several times, it must have several inbound links. BPMN uses a gateway as a join, with multiple incoming links and a single outgoing link, which is then a single inbound link to the task.
![[model with no gateway showing multiple inbound links]](/sites/community.bonitasoft.com/files/blog/olan/mri_scan.png)
Model with no gateway showing multiple inbound links
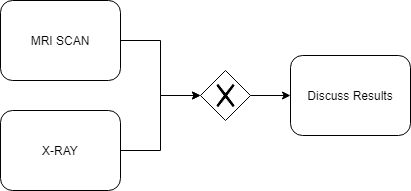
model showing detected gateway to represent multiple inbound links
This model is more readable and is now shown in standard BPMN 2.0 form.
Step 3. Detect Gateway types
The next article will explain how to detect gateway types, and create BPMN gateways directly from event logs.
Summary
In this article, we've identified the steps necessary to extract the underlying semantics of a business process starting only with its event log.
However, in order to be able to visualize that process using standard industry libraries like https://github.com/process-analytics/bpmn-visualization-js, we still need to generate the diagram representing it.
That will be covered in one of the next articles in this series.
About Olan