[Bonita UI Designer] Custom widget for BPMN Visualization
In this article, you will see how easy it is to create a preview for the Bonita BPMN model in a UI Designer Page.
Note that the DiagramAPI used in this example is only available in Enterprise Edition. Nevertheless you can use this BPMN diagram file externally, present it and use process analytics API to show some additional informative layers.
We will first create a custom widget, then place it in the UI Designer Page. Then we will create some variables and API calls to obtain the desired process. Finally, we will put it all together and pass the chosen process to the widget, so it is rendered and visible.
To render the BPMN model in this example I have used the Open Source Apache-2.0 library called BPMN Visualization. You can find more information about this library in the GitHub repository: BPMN Visualization.
Create a custom widget
- Launch the UI Designer.
- Create a new artifact of type Custom widget:
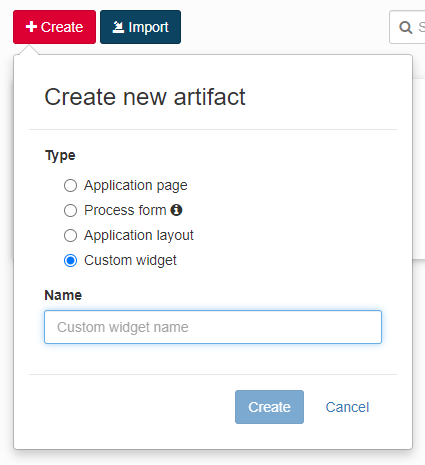
- Type bpmnVisualization as the custom widget name and click Create.
You will land in the widget editor. There are a few things to be done here:
- Template: replace default template div with:
<div id="bpmn-container"></div>
- Controller: your function should look like this:
function ($scope) {

  //initialize rendering library (added in the assets)

  const bpmnVisualization = new bpmnvisu.BpmnVisualization(window.document.getElementById('bpmn-container'));

  //load diagram when ready

  $scope.$watch('properties.bpmnXmlString', function() {

    var bpmnXml = $scope.properties.bpmnXmlString;

       if (bpmnXml) {

         bpmnVisualization.load(bpmnXml);

        }

  });

}
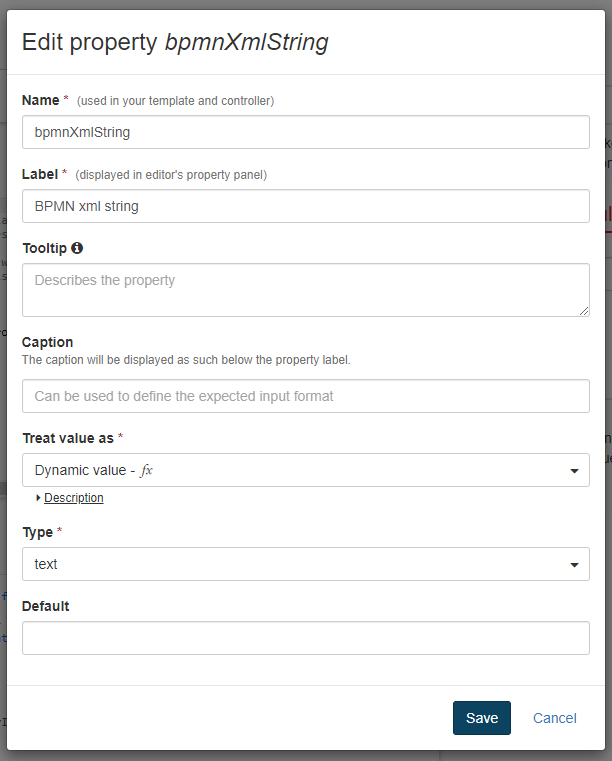
- Define property: bpmnXmlString
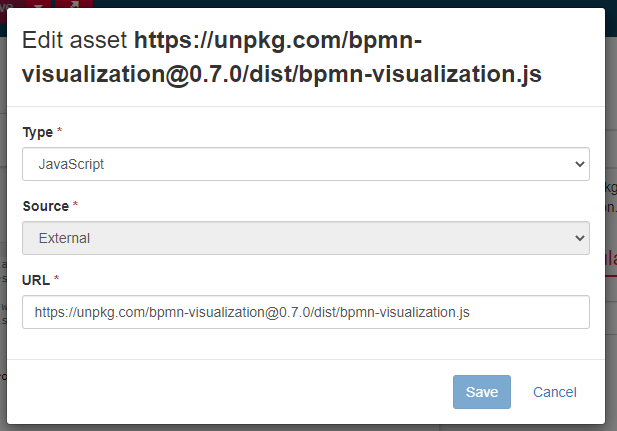
- Add a new asset: bpmn-visualization.js
- Type: JavaScript
- Source: External
- URL: https://unpkg.com/bpmn-visualization@0.7.0/dist/bpmn-visualization.js
Create an application page
Create a new artifact of type Application page.
For the name, you can use bpmnVisualization. Click Create. You will land in the page editor.
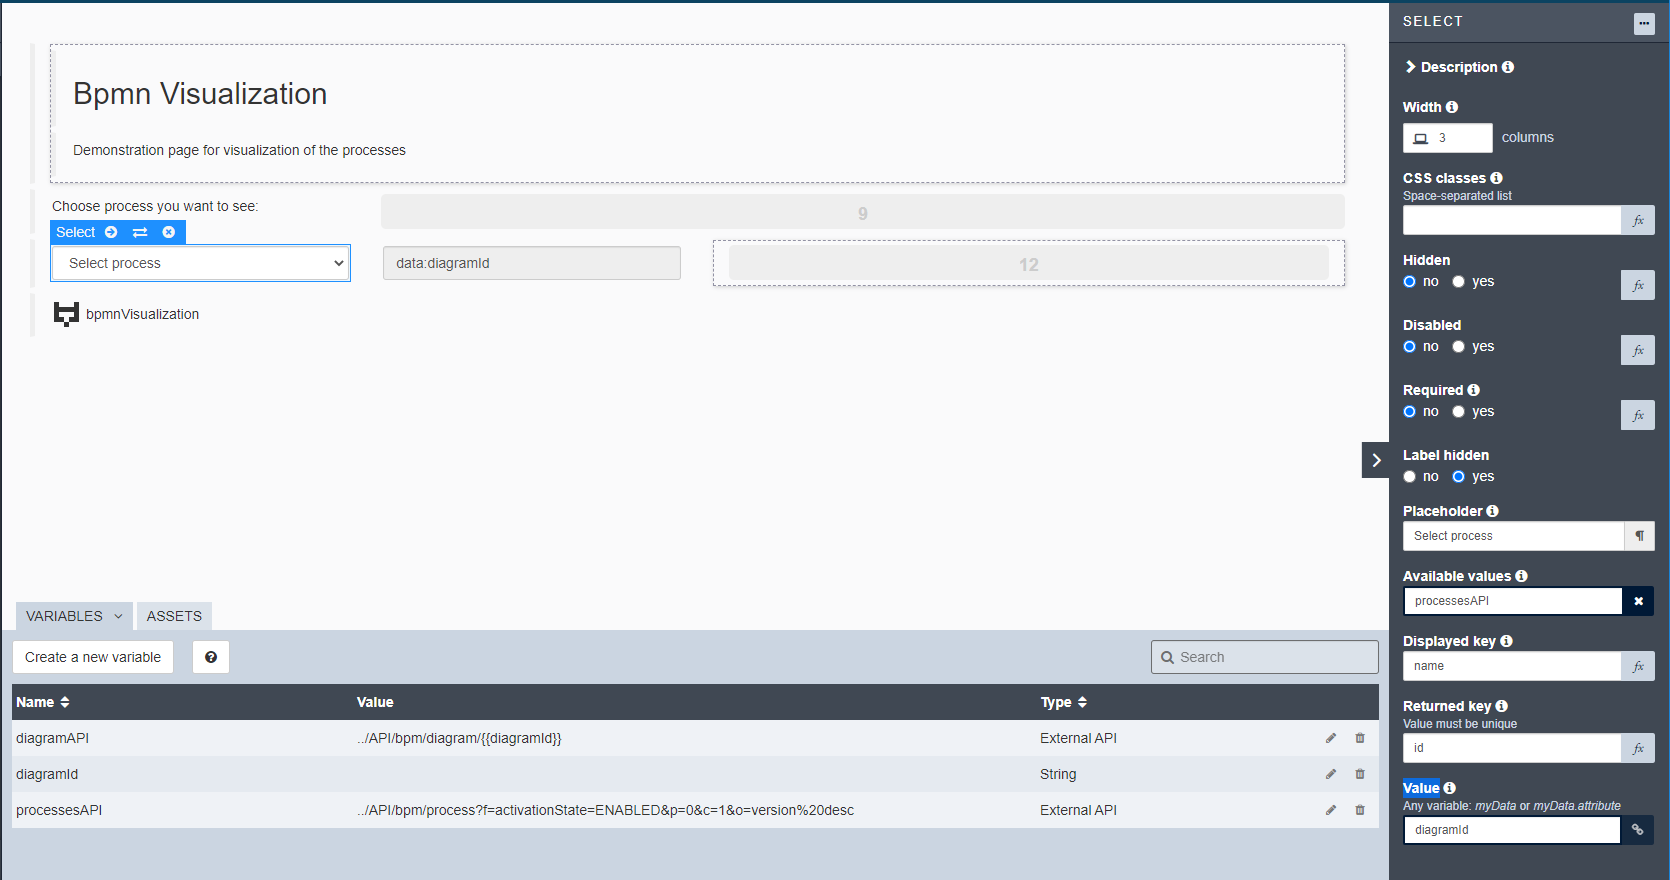
The final page should look like this:
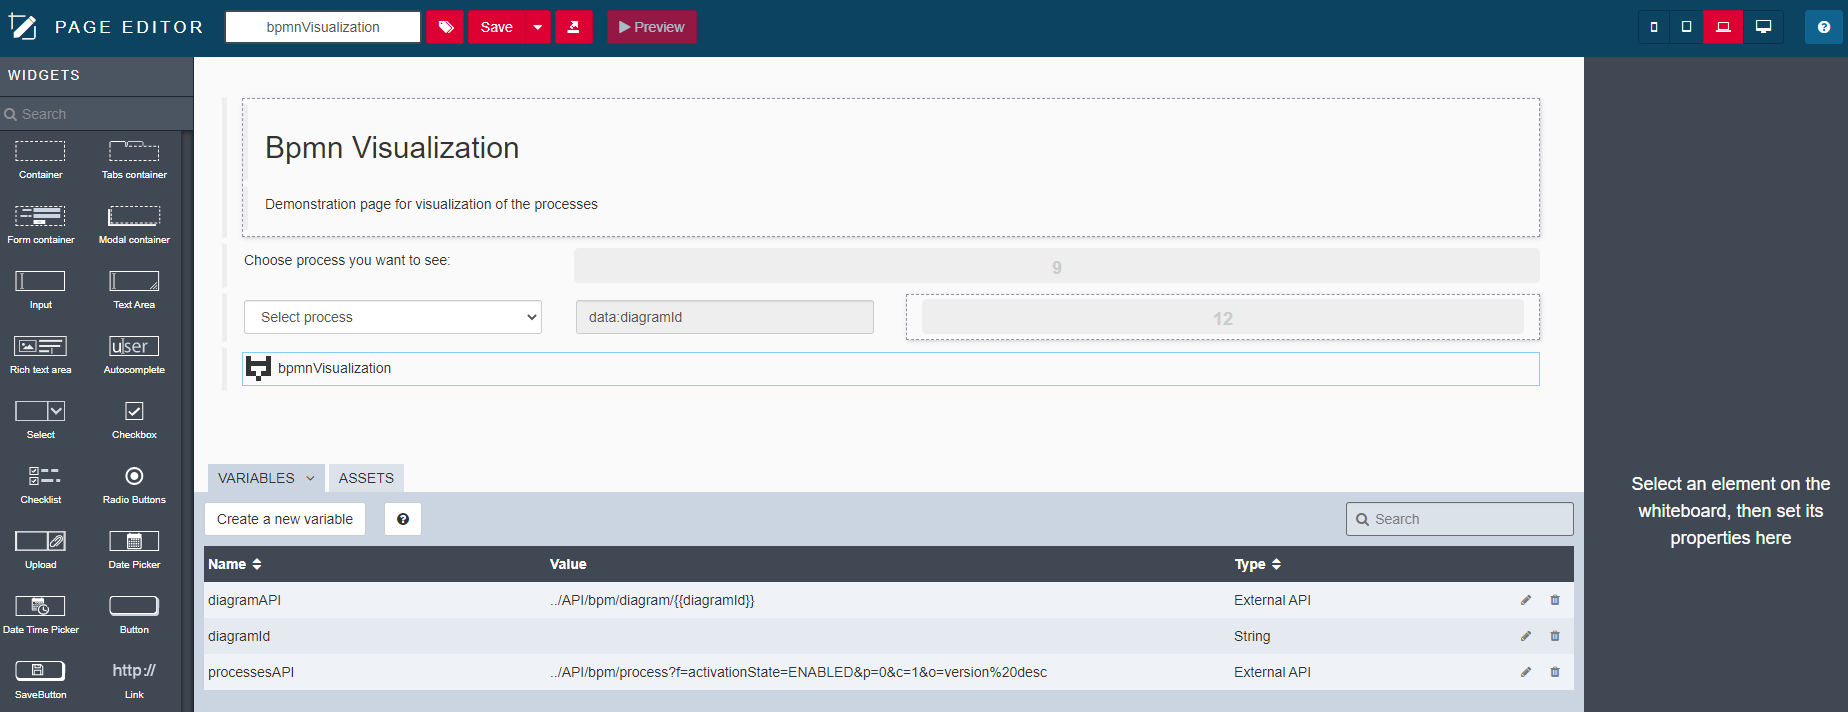
The layout is up to you - feel free to adjust anything you wish.
The core critical parts to make it work are:
3 variables:
- diagramId: type String. This will hold the id of the chosen process diagram.
- processesAPI: type external API, API URL:
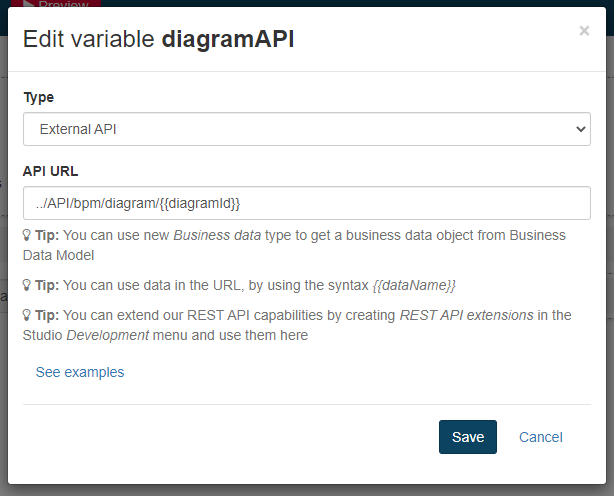
../API/bpm/process?f=activationState=ENABLED&p=0&c=10&o=version%20desc. This will hold available/accessible processes. - diagramAPI: type: external API, API URL:
../API/bpm/diagram/{{diagramId}}. This will hold the string representation of BPMN xml definition.
Link these variables to proper elements:
- Select setup:
- Available values: processesAPI
- Displayed key: name
- Returned key: id
- Value : diagramId
- Custom Widget (bpmnVisualization) setup:
- BPMN xml string: diagramAPI
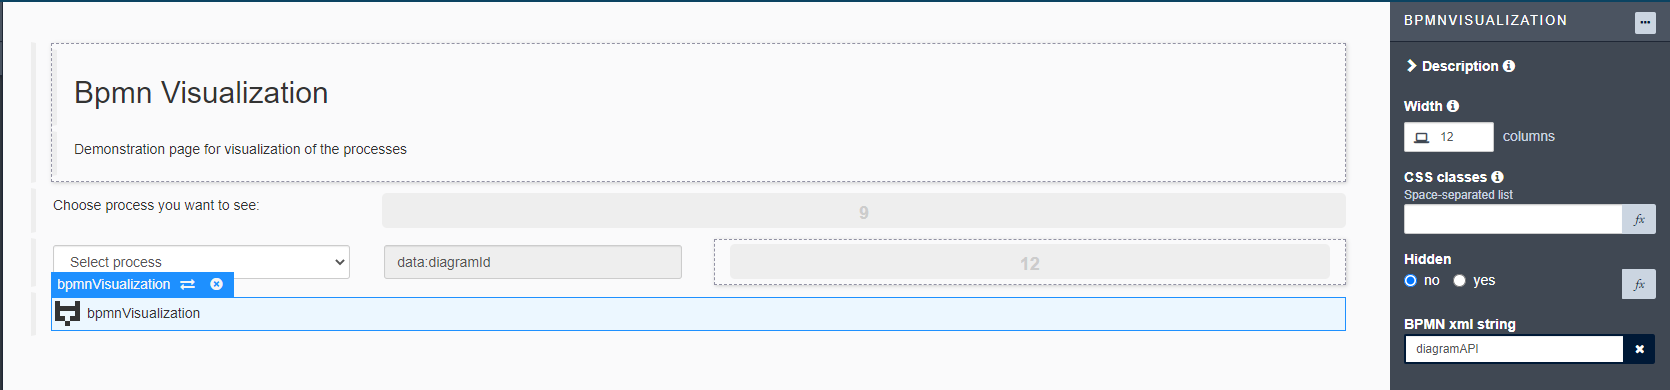
- Optionally we can set up the input, on the right side of the Select, to show us the currently chosen diagramId:
- Value: diagramId
- Type: text
We are all set!
Preview
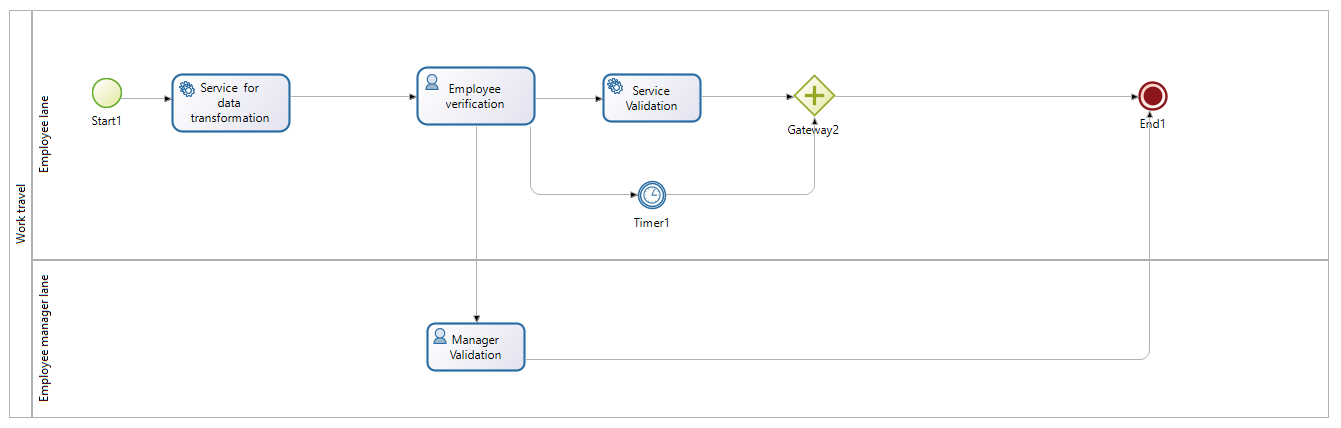
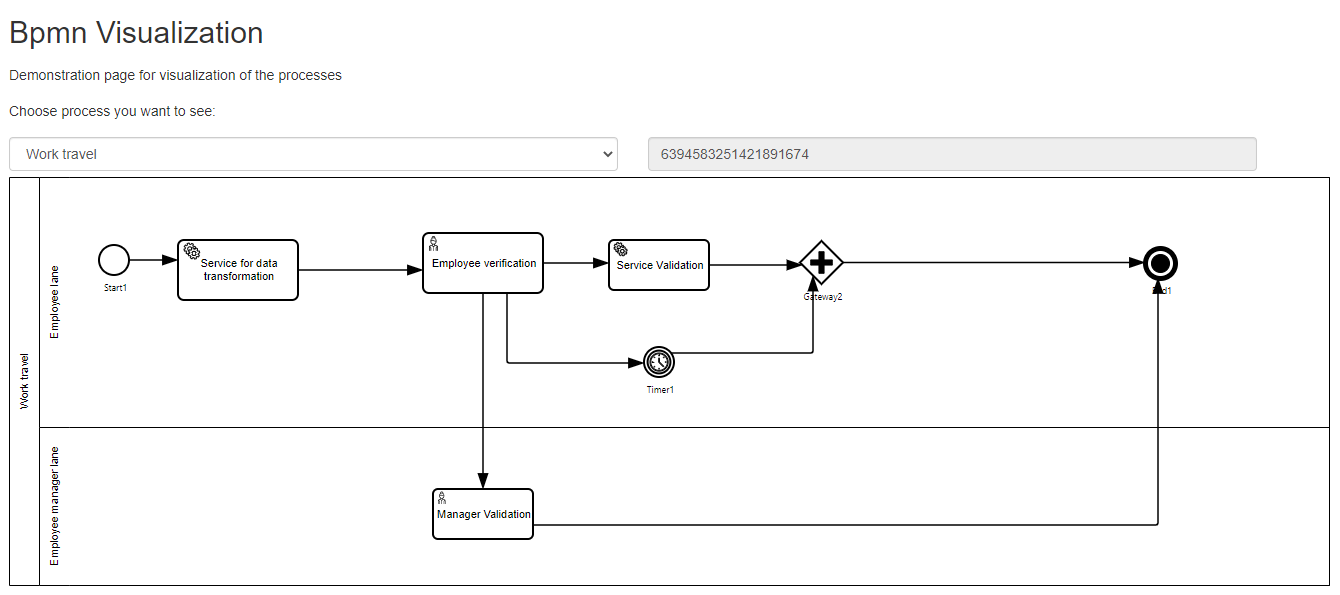
For the preview, create a simple process called Work travel in Bonita Studio.
Please make sure the user with whom you are testing has the necessary permissions: as a Process Manager for the desired process (confirm this in the Bonita Portal).
When we click on the Preview button in the UI Designer we should see the page where we can choose the process. Chose Work travel, and the output looks like this:
Note that the Open Source Apache-2.0 rendering library BPMN Visualization is highly customizable. You can check the examples here. To preview the code of the mentioned examples, go directly to the bpmn-visualization-examples repository.